Manufacturing equipment rarely fails without warning. A rising vibration reading, uneven product finish, or warmer motor housing may appear first. Evaluating performance turns these signals into practical decisions. It helps teams protect output, quality, worker safety, and maintenance budgets. Yet, the process is not simply about chasing higher speed. A machine running quickly but producing rejected parts is not performing well. The real question is broader: How To Evaluate Manufacturing Equipment Performance in a way that reflects daily production conditions.
Experienced engineers combine several measures rather than trusting one dashboard. They review availability, cycle time, throughput, first-pass yield, energy use, unplanned downtime, and maintenance response. Operators also provide valuable evidence through sound, smell, handling, and setup effort. A ten-minute stoppage may reveal more than a monthly average. Teams should compare current results with design specifications, recent history, and realistic production targets. Calibration records and consistent measurement methods matter. Otherwise, a precise-looking chart can support a weak conclusion. The numbers can mislead.
A credible evaluation examines the causes behind the figures. Lower output may come from material variation, worn tooling, training gaps, or an aging drive system. Documenting these conditions makes findings easier to verify and act upon. Independent inspections, supplier guidance, and recognized measurement practices can strengthen confidence. Still, no assessment is perfect. Data may be incomplete, and normal shift differences may be overlooked. Regular reviews, honest operator feedback, and small corrective trials create a more reliable picture over time. That picture supports safer investments and more resilient manufacturing.
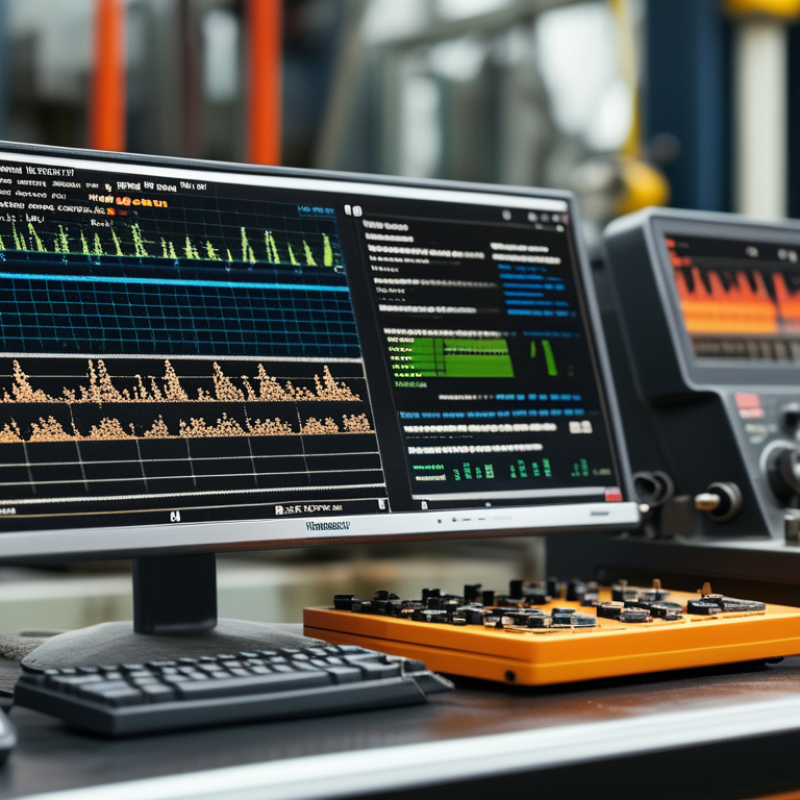
What Manufacturing Equipment Performance Evaluation Means
Manufacturing equipment performance evaluation means measuring how reliably a machine delivers its intended result. It is not just a speed test. A useful evaluation connects uptime, cycle time, product quality, energy use, and maintenance records. These figures should describe real production, not an ideal demonstration.
An engineer may compare scheduled hours with actual running hours. They may also check short stops, rejected units, temperature changes, and vibration readings. For example, a machine can meet its hourly target while losing minutes during repeated sensor resets. Those small delays often disappear from basic reports. Operator comments can reveal them. Practical experience matters because data rarely explains every interruption.
Reliable evaluation needs clear definitions, calibrated instruments, and consistent operating conditions. The same shift length, material type, and production speed should support each comparison. A single reading can mislead. We once treated lower energy use as an improvement, then found that output had also fallen. That result needed deeper review. Maintenance history, inspection notes, and quality samples should be checked together. The evaluation becomes more useful when it shows both strong performance and uncomfortable gaps.
Which Performance Metrics Reveal Equipment Effectiveness
Equipment effectiveness is not measured by output alone. A line producing 10,000 parts may still waste hours through brief stops, slow cycles, or rejected units. That is why plant teams examine several performance metrics together. Overall Equipment Effectiveness combines availability, performance, and quality. Availability exposes downtime. Performance compares actual speed with the designed cycle. Quality tracks good pieces against total production. One number rarely explains the fault. Context matters.
Maintenance records add a practical layer. Mean Time Between Failures shows unexpected stop frequency, while Mean Time To Repair reveals recovery speed. High MTBF with rising scrap can indicate stable but inaccurate processing. Short MTTR may hide repeated temporary fixes. Track unplanned downtime, changeover duration, scrap rate, and schedule adherence beside OEE. During a night shift, twelve two-minute stoppages may disappear inside a daily average. Operators usually remember them.
Energy per acceptable unit and compressed-air losses can expose inefficiency that production counts miss. Use sensor data, operator logs, and maintenance reports, then verify conflicting readings at the machine. Data is not automatically truthful. A stopped sensor can make availability look perfect. Metrics also need a time window, product type, and operating condition. Comparing a short trial run with a full shift creates false confidence. Reviewing these measures weekly links lost minutes to causes. Yet targets can reward convenient reporting instead of real improvement.
Why Evaluate Manufacturing Equipment Performance? - Which Performance Metrics Reveal Equipment Effectiveness
| Equipment Area |
Performance Metric |
Definition / Calculation |
Observed Value |
Reference Target |
Effectiveness Signal |
Recommended Action |
| CNC Machining |
Overall Equipment Effectiveness (OEE) |
Availability × Performance × Quality |
72.4% |
≥85% |
Capacity is being lost through downtime and reduced cycle speed. |
Prioritize the largest availability and performance losses during daily review. |
| Packaging Line |
Availability |
Run time ÷ Planned production time × 100 |
86.8% |
≥90% |
Unplanned stops and changeovers are reducing productive time. |
Reduce minor stoppages and standardize changeover procedures. |
| Assembly Cell |
Performance Rate |
Actual output ÷ Theoretical output during run time × 100 |
81.5% |
≥95% |
The equipment is operating below its designed production speed. |
Investigate micro-stoppages, speed losses, tooling wear, and operator loading. |
| Heat Treatment Furnace |
First-Pass Yield |
Units passing inspection without rework ÷ Total units × 100 |
97.6% |
≥98% |
Quality is stable, but process variation remains measurable. |
Review temperature uniformity, recipe adherence, and calibration records. |
| Injection Molding |
Scrap Rate |
Rejected units ÷ Total units produced × 100 |
3.2% |
≤2% |
Material, setup, or process-control losses are increasing production cost. |
Use defect Pareto analysis and verify mold temperature and pressure settings. |
| Automated Press |
Mean Time Between Failures (MTBF) |
Operating time ÷ Number of equipment failures |
46.5 hours |
≥60 hours |
Failures are occurring more frequently than the maintenance plan assumes. |
Identify recurring failure modes and strengthen preventive maintenance tasks. |
| Conveyor System |
Mean Time to Repair (MTTR) |
Total corrective maintenance time ÷ Number of repairs |
38 minutes |
≤30 minutes |
Recovery time is extending production interruptions. |
Improve fault isolation, spare-parts availability, and technician response procedures. |
| Welding Cell |
Unplanned Downtime |
Unscheduled stop time ÷ Planned production time × 100 |
6.9% |
≤5% |
Unexpected equipment interruptions are affecting schedule reliability. |
Track downtime by cause, shift, and component to target corrective actions. |
| Plant Utilities |
Energy Intensity |
Energy consumed ÷ Good units produced |
2.8 kWh/unit |
≤3.0 kWh/unit |
Energy use is within the operating benchmark. |
Continue monitoring idle consumption, leaks, and peak-load operation. |
| Production Fleet |
Schedule Attainment |
Orders completed on time ÷ Scheduled orders × 100 |
91.0% |
≥95% |
Equipment constraints are contributing to missed production commitments. |
Connect equipment losses with production planning and capacity reviews. |
Performance Review Note:
Evaluate availability, speed, quality, reliability, maintainability, energy use, and schedule attainment together. A single metric can hide the operational cause of lost effectiveness.
How Data Is Collected and Analyzed During Evaluation
Why Evaluate Manufacturing Equipment Performance?
How Data Is Collected and Analyzed During Evaluation
Evaluating manufacturing equipment starts with reliable, observable data. Technicians record cycle time, output volume, stoppages, energy use, and product defects. Sensors can capture vibration, temperature, pressure, and motor load at regular intervals. Manual checks remain valuable because operators often notice unusual sounds before instruments detect them.
Data can mislead.
A calibrated stopwatch may confirm cycle time, while maintenance logs explain unexpected delays. Teams should collect readings across different shifts, workloads, and operating temperatures. One quiet morning cannot represent normal performance. Each record needs a timestamp, machine condition, product type, and operator note. Without this context, accurate measurements may still support poor decisions.
Analysts usually compare actual output with the equipment’s approved operating range. They calculate averages, variation, downtime percentages, and repeated fault patterns. Control charts can show whether performance is stable or slowly declining. However, our first sampling plan may be too neat. It can overlook short interruptions that workers handle automatically. Reviewing video, log entries, and operator feedback can expose those hidden losses. A useful evaluation combines sensor data with practical experience. The machine may be stable, but the process is not. Regularly checking calibration also protects the credibility of every result.
Why Performance Evaluation Supports Maintenance and Safety
Manufacturing equipment performance evaluation is not merely a production exercise. It directly supports safer maintenance decisions. A machine may still run while developing dangerous weaknesses.
When a motor begins drawing more current, its bearings may be wearing. Unusual vibration can reveal imbalance, loosened mounts, or poor alignment. These signs often appear before a sudden breakdown. Small changes matter.
During routine inspections, technicians can compare operating temperatures, noise levels, vibration readings, and energy use. They can also check guards, emergency stops, cables, and fluid leaks. Clear records help maintenance teams schedule repairs before workers face unnecessary exposure. They reduce rushed interventions during night shifts or production pressure. That practical advantage is easy to underestimate.
Performance data also supports safer work planning. A high-temperature surface may require cooling time and protective equipment. A recurring jam may indicate a design or adjustment problem, not operator error. However, measurements can mislead when sensors are poorly placed or records are incomplete. One reading is not proof. Teams should confirm unusual results through visual checks and repeated tests. This is where professional judgment matters. No evaluation method is perfect. A missed trend, an incorrect baseline, or a hurried inspection can still create risk. Maintenance leaders should review findings with operators, document decisions, and question assumptions when the evidence feels incomplete.
How Evaluation Results Guide Operational and Investment Decisions
Why Evaluate Manufacturing Equipment Performance?
Equipment evaluation turns daily production data into practical operational and investment decisions. A machine may show acceptable output while consuming more energy, causing small stoppages, or producing inconsistent dimensions. Review cycle time, first-pass yield, unplanned downtime, vibration readings, temperature, and maintenance history together. One metric rarely tells the full story. A production supervisor should compare current results with baseline performance and recent operating conditions. For example, a gradual temperature increase near a bearing can justify inspection before failure disrupts an entire shift.
Tips: Use the same measurement method each time. Record shift, product type, load, operator notes, and environmental conditions. Verify sensor accuracy regularly. Ask operators what the numbers miss. Their observations often reveal unusual noise, difficult adjustments, or repeated minor faults.
Evaluation results also shape capital planning. If repairs restore stable performance at a reasonable cost, continued operation may be sensible. If downtime, quality losses, and energy use keep rising, replacement or redesign deserves closer analysis. Calculate total ownership cost, not only purchase price. Include installation, training, spare parts, maintenance, expected capacity, and disposal requirements. Still, forecasts are imperfect. A promising payback estimate can fail when demand changes or commissioning takes longer than planned. Decision teams should test several scenarios and document their assumptions. Independent technical review can challenge optimistic figures before funding is approved.
Conclusion
Evaluating manufacturing equipment performance is a structured process for determining how effectively machines support production goals. How To Evaluate Manufacturing Equipment Performance involves examining key metrics such as availability, throughput, operating speed, quality rate, downtime, energy use, and overall equipment effectiveness. These measurements help organizations identify performance gaps, recurring delays, capacity limitations, and opportunities to improve productivity. Data may be collected through sensors, production records, operator observations, maintenance logs, and scheduled inspections, then analyzed to reveal trends and root causes.
Performance evaluation also supports safer and more reliable operations by identifying abnormal conditions, wear, and potential equipment failures before they cause serious disruption. The results help maintenance teams prioritize preventive work, reduce unplanned downtime, and use resources more efficiently. In addition, managers can use reliable performance data to adjust workflows, improve training, plan capacity, compare improvement initiatives, and make informed decisions about repairs, upgrades, replacement, and future investment.

 Hanora Medical